Faster dashboard metrics

Dashboard usage and error metrics now load faster as ScreenshotOne continues operating millions of screenshots every month.

Changelog1 min read

Written by

Dmytro Krasun

Published on

We improved how usage and error metrics are loaded in the dashboard.

Previously, the dashboard calculated these charts directly from the request history. That worked for smaller accounts, but it could be slow for organizations with a large number of requests.

ScreenshotOne now operates millions of screenshots every month, and this was an important performance change for customers with larger workloads. Keeping the product fast and stable is one of our duties, and we continue to dedicate engineering time to performance improvements across the API and dashboard.

The dashboard now reads precomputed hourly metrics for the usage chart and error breakdowns. This keeps the dashboard responsive while preserving the same counts customers expect to see.
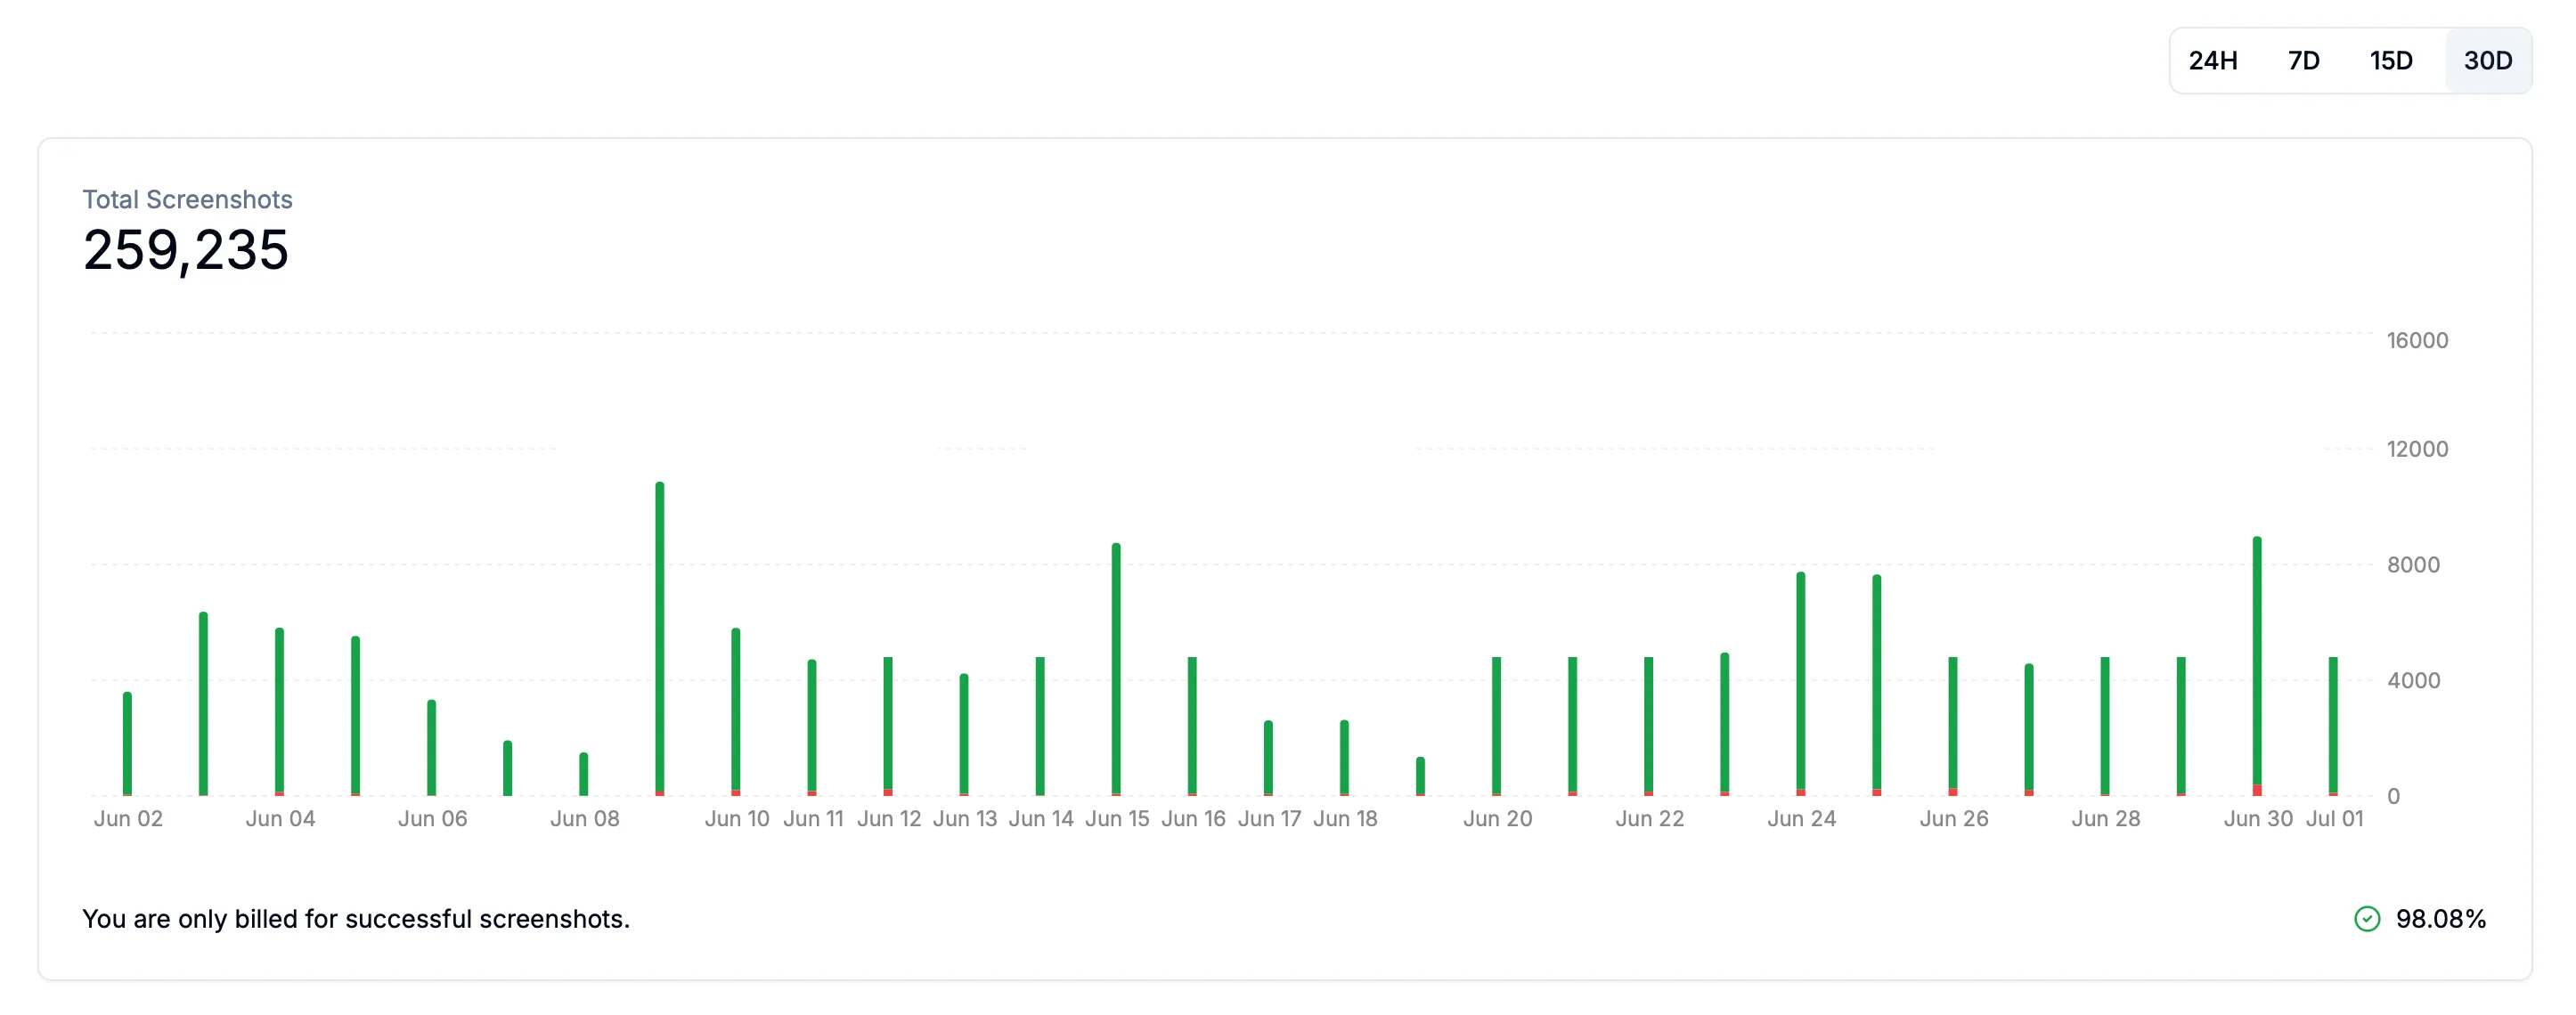
Dashboard usage and error metrics

There are no API changes required. The improvement is available automatically in the dashboard.

If you notice any issues or have feedback, please reach out at support@screenshotone.com. Thank you for using ScreenshotOne.
Read more product updates

New features, bug fixes, and optimizations...

View all product updates
Rendering errors in webhooks

Rendering errors in webhooks

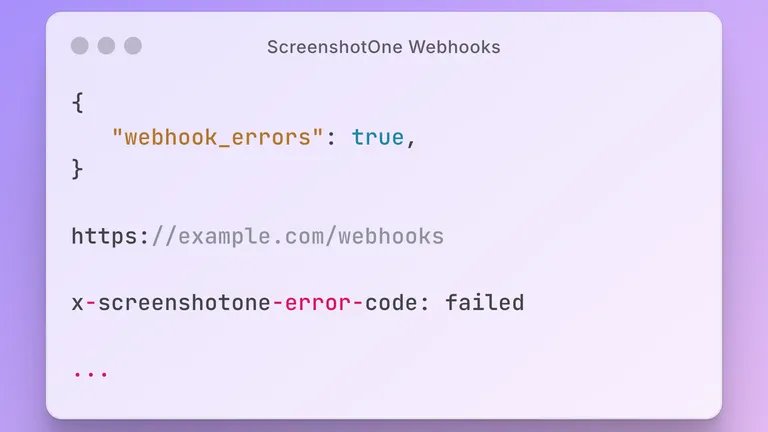
Check out how to get notified about rendering errors when using webhooks.

Read more

1 min read

Support for multiple API keys

Support for multiple API keys

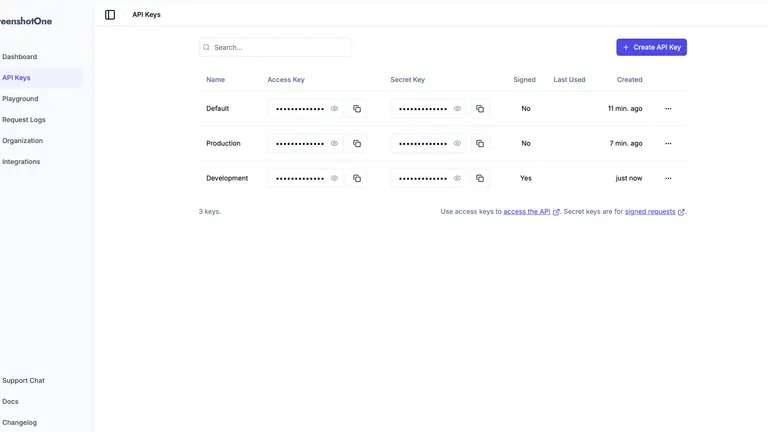
You can now use multiple API keys to the access ScreenshotOne API.

Read more

1 min read

Added a URL to PDF Tool

Added a URL to PDF Tool

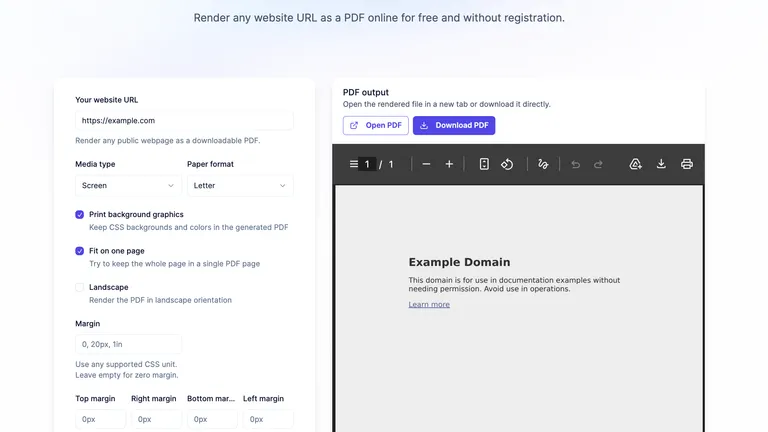
A new free ScreenshotOne tool to convert any public webpage URL into PDF.

Read more

1 min read

Automate website screenshots

Exhaustive documentation, ready SDKs, no-code tools, and other automation to help you render website screenshots and outsource all the boring work related to that to us.